
OIKAWA Masato, Assistant Professor
Evaluating policies by analyzing existing policy data
My specialty is economics. I analyze and evaluate policies implemented by the national and local governments, using statistical methods. I have examined whether the introduction of metabolic syndrome checkups has improved the health of middle-aged and older adults, and have analyzed how children’s mental health was affected by caring for their parents.
In October 2022, a policy was implemented to increase out-of-pocket medical expenses to 20% coverage for those with a certain income among those aged 75 or older who had been paying 10% of their out-of-pocket medical expenses. The resulting impacts on medical demands of the eligible persons such as the number of hospital visits and medical expenses were analyzed based on the data currently managed by the Ministry of Health, Labor and Welfare.
What impacts have been brought about on the medical demands by the increase in burden at the counter?
Due to the implementation of this policy, single late-stage elderly people whose annual income exceeds 2 million yen are now required to pay 20% of their medical expenses, a 10% increase from 10%. Therefore, I compared two groups of singles with annual incomes: those whose annual medical expenses burden increased from 10% to 20% (annual income is between 2 million yen and 2.5 million yen) and those who remained on the 10% burden (annual income is between 1.5 million yen and less than 2 million yen). Data from more than 100,000 men and women across the country were used in this analysis.
First, I will show you the impact on total medical expenses (Fig. 1)
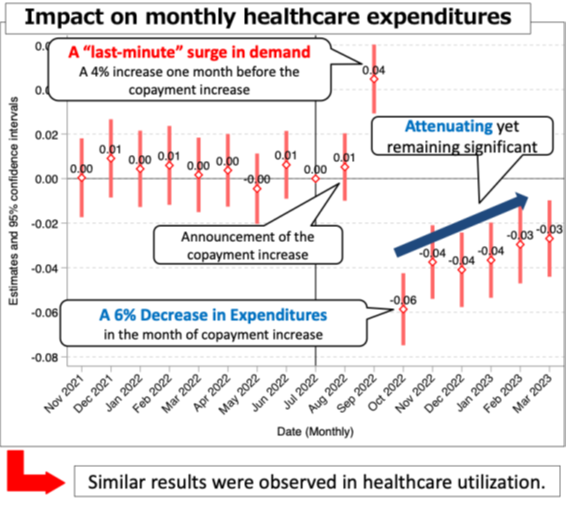
Fig. 1 Monthly changes in total medical expenses. Based on the month prior to August 2022 (July 2022), when the change in the burden ratio was notified, the red diamonds represent the “differences in total medical expenses of the two groups.” The vertical axis is the “estimates and 95% confidence interval,” and months in which the red bars across 0.00 on the vertical axis indicate that the differences between the two groups were not significantly different from those in the reference month.
The red diamonds in Figure 1 represent the “differences in total medical expenses for the two groups”, taking July 2022 (the month just before the notification) as the reference month. And the value of 0.01 means a 1% increase compared to the reference month. Red bars across 0.00 on the vertical axis show that the two groups were “statistically not different,” and the data on Figure 1 indicate the two groups had similar changes in total medical expenses in the pre-notification period. For the group that will continue to pay 10% of the medical expenses, it can be assumed that the total medical expenses will not change significantly, since the total amount to be paid should remain the same even after the notification.
Based on the above, the 4% increase in September 2022 can be attributed to the rush of those who will increase to 20% coverage of their medical expenses before the policy was implemented. On the other hand, the fact that the number of patients decreased by 6% in October 2022, when the policy was implemented, can be attributed to the result that people who had to pay 20% of their medical expenses curbed their medical expenses. And later, over time, the differences in medical expenses have been on the decrease. This can be considered that the impact of the rush demand has been gradually fading away and only the impact of the increased burden has been shown.
Also, when I conducted a similar analysis of medical expenses by category (outpatient, dispensary, and dental) for the two groups and whether or not they used medical expenses by category (differences in percentage of visits), I found the same trends as for total medical expenses. However, in the analysis of “hospitalization,” no statistically significant impact was observed, leading to the conclusion that there was no impact from raising the medical expenses coverage to 20%.
In conclusion, the policy of raising out-of-pocket medical expenses can be interpreted as having had some impacts before and after the implementation of the policy with respect to total medical expenses and people’s decision to go to the hospital or not, except for serious cases involving hospitalization, but the impact has diminished over time.
Effects of the policy and what should be done in the future
In the six months from February 2022 to July 2022, the total medical expenses for those whose out-of-pocket medical expenses went up to 20% coverage was 1.3 trillion yen. Since medical expenses have decreased by approximately 3% since the policy was implemented, we can see that 3% of 1.3 trillion yen, or approximately 40 billion yen, has been reduced (Fig. 2). Through this analysis, it was possible to quantitatively evaluate that this policy has had a significant effect on medical expenses savings.
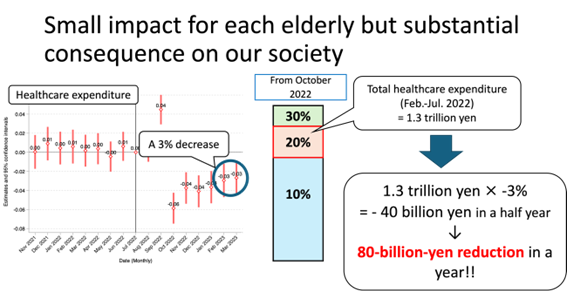
Fig. 2 The amount of reduction in medical expenses for those whose out-of-pocket medical expenses have been raised to 20% coverage due to the policy.
I believe that in the future we need to do a similar analysis for each type of disease and look in detail to see if there are any “refraining from using medical expenses” that can increase serious health risks so that they would not lead to future expansion of medical expenses. Furthermore, I will continue to observe the impact of this policy and look closely to see if the decline is stable, and hope to make recommendations for future policies.
Coverage/Constitution: Keiko AIMONO
Cooperation: Graduate School of Political Science, Waseda University, J-School